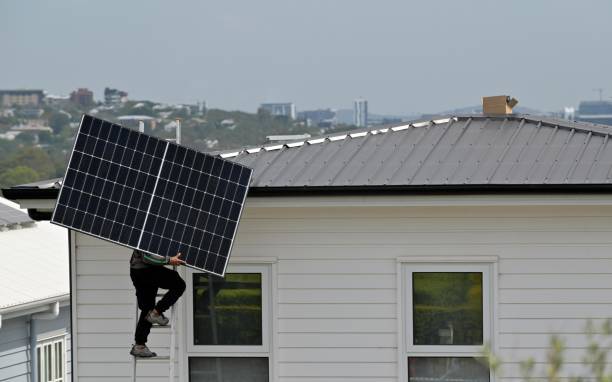
Australia is experiencing a solar revolution, and the numbers tell an incredible story. With over 30% of Australian households now equipped with solar panels, we’ve become one of the world’s leading solar nations. But what’s driving this massive uptake, and what does it mean for households still considering making the switch?
The Solar Boom: Australia Leading the World
Australia leads the world in residential uptake of solar, with a nation-wide average of free-standing households with a PV system at over 20%. In fact, solar energy systems on households have more than doubled since 2018 – now at nearly a third of all households (32.3%).
This isn’t just a trend—it’s a fundamental shift in how Australians power their homes. Rooftop solar now accounts for 11.2 per cent of Australia’s electricity supply, and remarkably, Australia generated 25% of its electricity from solar power in October 2024.
State-by-State Solar Adoption: Where Australia Stands
The solar adoption varies significantly across states, with some regions leading the charge:
The Solar Leaders
South Australia leads with 44.5% of households having solar installations, closely followed by Western Australia at 43%. These sun-drenched states demonstrate what’s possible when households embrace solar technology.
Strong Performers
New South Wales leads the way in total installations, closely followed by Victoria and South Australia. New South Wales continues to have the highest installed rooftop solar capacity at 7.5 GW (over a quarter of Australia’s capacity).
The Growth States
Queensland saw the highest amount of total capacity installation in a 6-month period in 2025, reaching 326 MW compared to NSW’s 321 MW, showing that solar adoption continues accelerating across the country.
Curious about how your state compares and what incentives are available in your area? Compare Your Rates connects you with local solar specialists who understand your regional programs and can show you exactly what’s possible for your home.
The Numbers Behind the Solar Success
System Sizes Are Growing
Australian households are getting smarter about their solar investments. The average installed solar system size has continued to increase year-on-year, increasing 4.1% compared to 12 months prior, with the 6-month rolling average growing to 10.2kW per solar system installation.
This trend toward larger systems makes financial sense—households are maximising their roof space to capture more free electricity and greater long-term savings.
Replacement Market Emerging
An interesting trend is emerging: since 2021, Australia’s solar system replacement portion has increased from 10% of systems, to 22% of the total installations being replacement system installations. Early solar adopters are upgrading to newer, more efficient technology, showing the long-term commitment Australians have to solar energy.
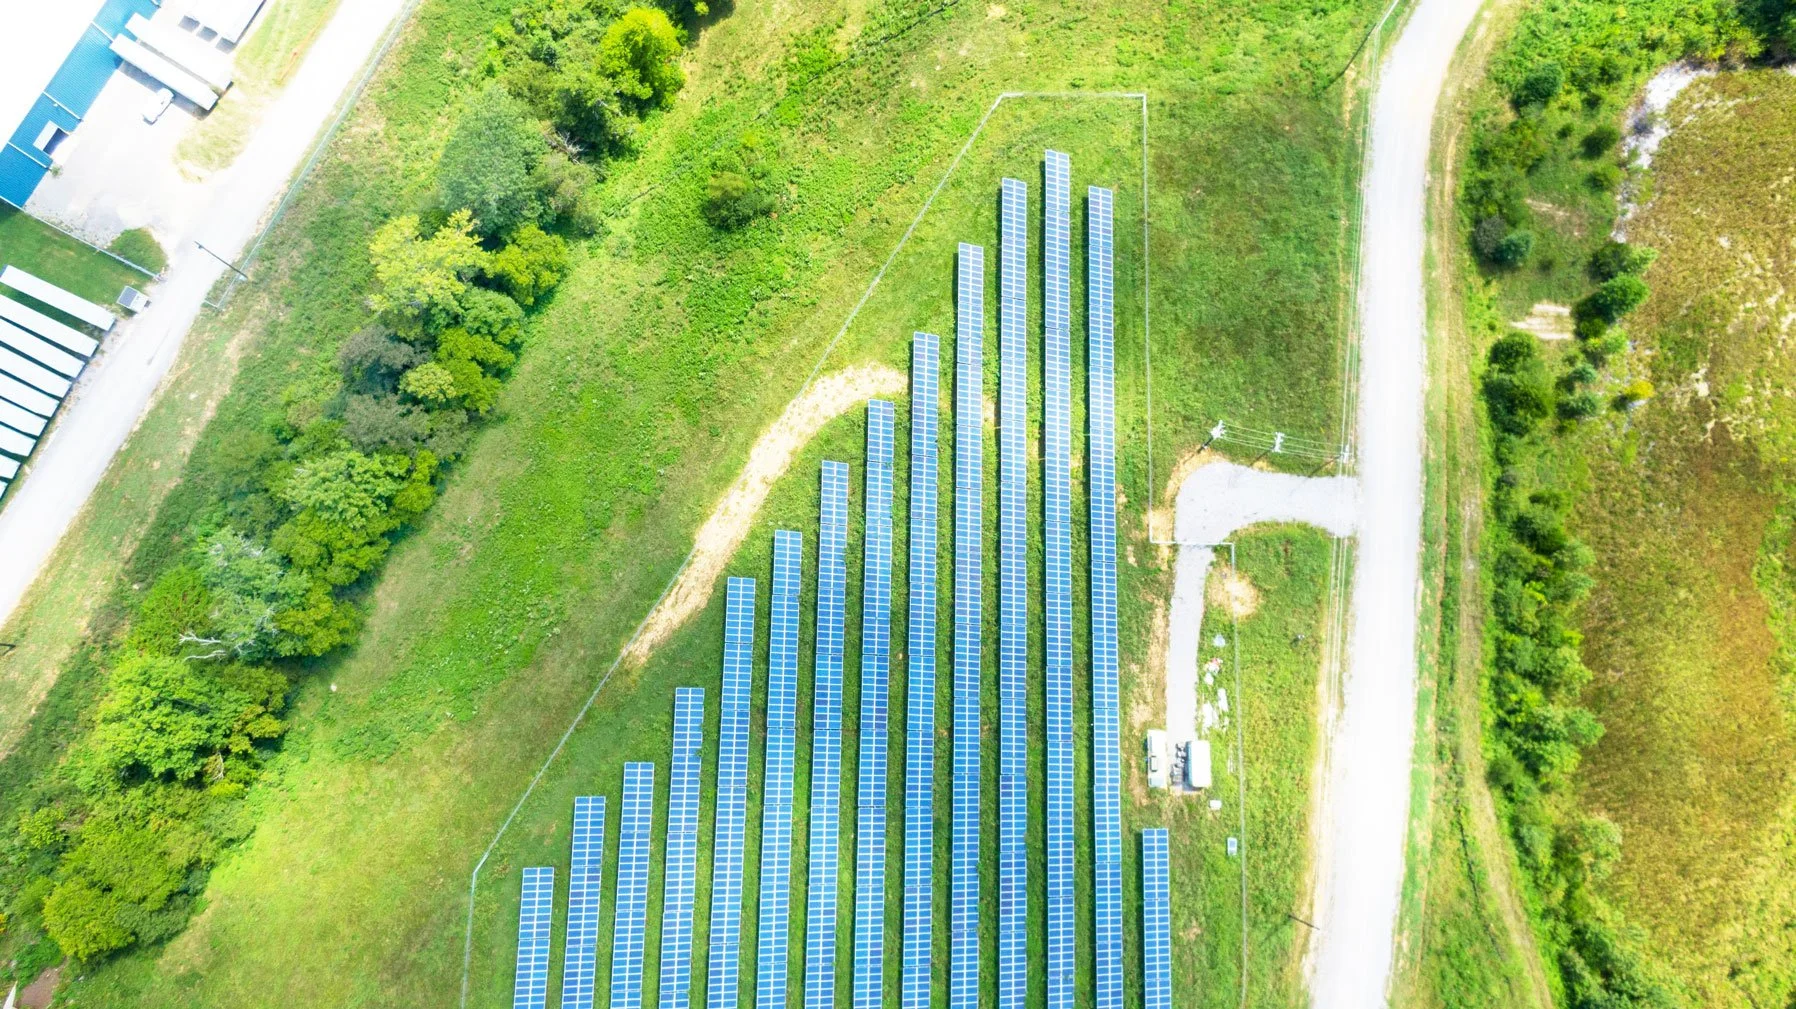
Battery Storage Boom
The solar story doesn’t end with panels. In the first 6-months of 2025, there were 85,000 battery storage sales in Australia, reaching a 191% increase from the same period last year. This massive growth in battery adoption shows households want complete energy independence, not just reduced bills.
What These Statistics Mean for Your Household
You’re Not Alone—You’re Joining the Majority
With over 3 million Australian households already using solar, you’re not taking a risk—you’re joining a proven trend that’s delivered results for millions of families across the country.
The Technology Is Proven and Mature
When 30%+ of your neighbours have solar systems that are working reliably day after day, it demonstrates the technology has moved well beyond experimental. These systems are delivering consistent results for millions of Australian families.
Early Adopters Are Doubling Down
The fact that 22% of current installations are system replacements shows that households who got solar early loved it so much they’re upgrading to even better technology. This speaks volumes about solar’s real-world performance.
The Financial Case Is Clear
Rooftop solar contributed 12.8% in generation share compared to 11.5% the year prior, even with fewer installations. This improved efficiency means newer systems are generating more value per dollar invested.
Regional Success Stories
South Australia: The Solar Pioneer
With nearly half of all households having solar, South Australia demonstrates what’s possible. The state’s leadership in solar adoption has resulted in some of the most affordable daytime electricity rates in Australia and energy security during peak demand periods.
Western Australia: Sun-Rich Success
WA’s 43% household adoption rate shows how well solar performs even in geographically isolated areas. The state’s abundant sunshine and high electricity costs make solar an obvious choice for most households.
Queensland and NSW: Scale and Growth
These populous states are proving that solar works in diverse climates and housing types, from inner-city terraces to sprawling suburban homes and rural properties.
Want to see what solar could achieve for your specific home and location? Our comparison service connects you with installers who understand your local conditions and can provide accurate projections based on your neighbourhood’s proven results.
Why the Momentum Is Building
Network Effects
As more households install solar, the benefits multiply. Reduced peak demand on the grid helps keep electricity prices stable for everyone, while increasing solar generation during the day reduces overall system stress.
Technology Improvements
Each year brings better panels, smarter inverters, and more affordable battery storage. Today’s systems are significantly more efficient and cost-effective than those installed even five years ago.
Economic Pressure
With electricity prices continuing to rise, solar provides a hedge against future increases. Households with solar are protecting themselves from market volatility while those without solar face increasing exposure to price rises.
The Cost of Being Late to Solar
Missing the Peak Rebate Period
Government incentives decrease over time. The federal STC rebate reduces every year and will phase out entirely by 2030. Households installing solar today receive significantly more support than those who wait.
Rising Installation Costs
While solar panel prices have stabilised, installation costs may increase due to higher demand and skilled labour shortages. Early installation locks in today’s pricing.
Foregone Savings
Every quarter without solar is money left on the table. With typical payback periods of 3-6 years, delaying installation means delaying the start of your savings period.
What This Means for Your Decision
The statistics are clear: solar isn’t experimental technology anymore—it’s mainstream, proven, and delivering results for over 3 million Australian households. The question isn’t whether solar works, but whether you want to continue paying full retail electricity rates while your neighbours enjoy the benefits of free daytime power.
With over 30% of households already switched to solar and adoption accelerating every quarter, the solar revolution isn’t coming—it’s here. The early adopters have proven the technology works, the financial benefits are real, and the environmental impact is positive.
Compare Solar Options for Your Home
Ready to join the millions of Australian households already benefiting from solar? The statistics show that solar delivers reliable results, but the right system for your home depends on your specific circumstances, roof type, energy usage, and local conditions.
Compare Your Rates takes the complexity out of solar decision-making. Instead of researching installers individually, our service connects you with multiple qualified solar specialists in your area. You’ll get competitive quotes, accurate projections based on local data, and the confidence that comes from comparing proven options.
Don’t wait while rebates decrease and electricity prices rise. Get your free solar comparison today by visiting Compare Your Rates and discover why over 3 million Australian households have already made the smart switch to solar.